DoWhy is a Python library that structurally supports the causal inference process by integrating causal graphical models and the potential outcomes framework. Its major advantage is that it's designed to easily answer various causal questions — including causal effect estimation, counterfactual analysis, and root cause analysis — enabling even beginners to perform reliable analyses. This summary provides a detailed guide on DoWhy's features, usage methods, provided capabilities, and reference materials.
1. Project and Community Overview
What Is DoWhy?
DoWhy is an open-source Python library that can explicitly model causal relationships between variables and directly validate causal estimates. It goes beyond simple prediction to support answering causal questions such as "What caused what?" and "How would the outcome change if we modified a specific variable?"
"Decision-making involves understanding the interactions between various variables and predicting how outcomes would change when some are set to new values."
DoWhy is part of the PyWhy ecosystem, and visiting the PyWhy GitHub reveals various related causal inference tools. As it's used by practitioners, researchers, and developers alike, active Q&A and case sharing take place on the Discord community.
"If you have questions, opinions, or need discussion about specific use cases, please join our Discord community."
- Official documentation: https://py-why.github.io/dowhy
- PyWhy GitHub: https://github.com/py-why/
- Community (Discord): https://discord.gg/cSBGb3vsZb
2. Use Cases and Practical Examples
DoWhy is used in various real-world scenarios to solve causal questions like:
- Effect estimation: Causal factors behind hotel booking cancellations, effects of customer membership programs, article title optimization, early childhood health visit effectiveness, customer churn causes, etc. (Hotel booking cancellation case, Membership effects, etc.)
- Root cause analysis/explanation: Causes of anomalies in online stores, latency sources in microservice architectures, identifying causes of supply chain changes, etc. (Online store root cause analysis, Supply chain changes, etc.)
More examples can be found in the DoWhy example notebooks.
3. DoWhy's Architecture and Core Features
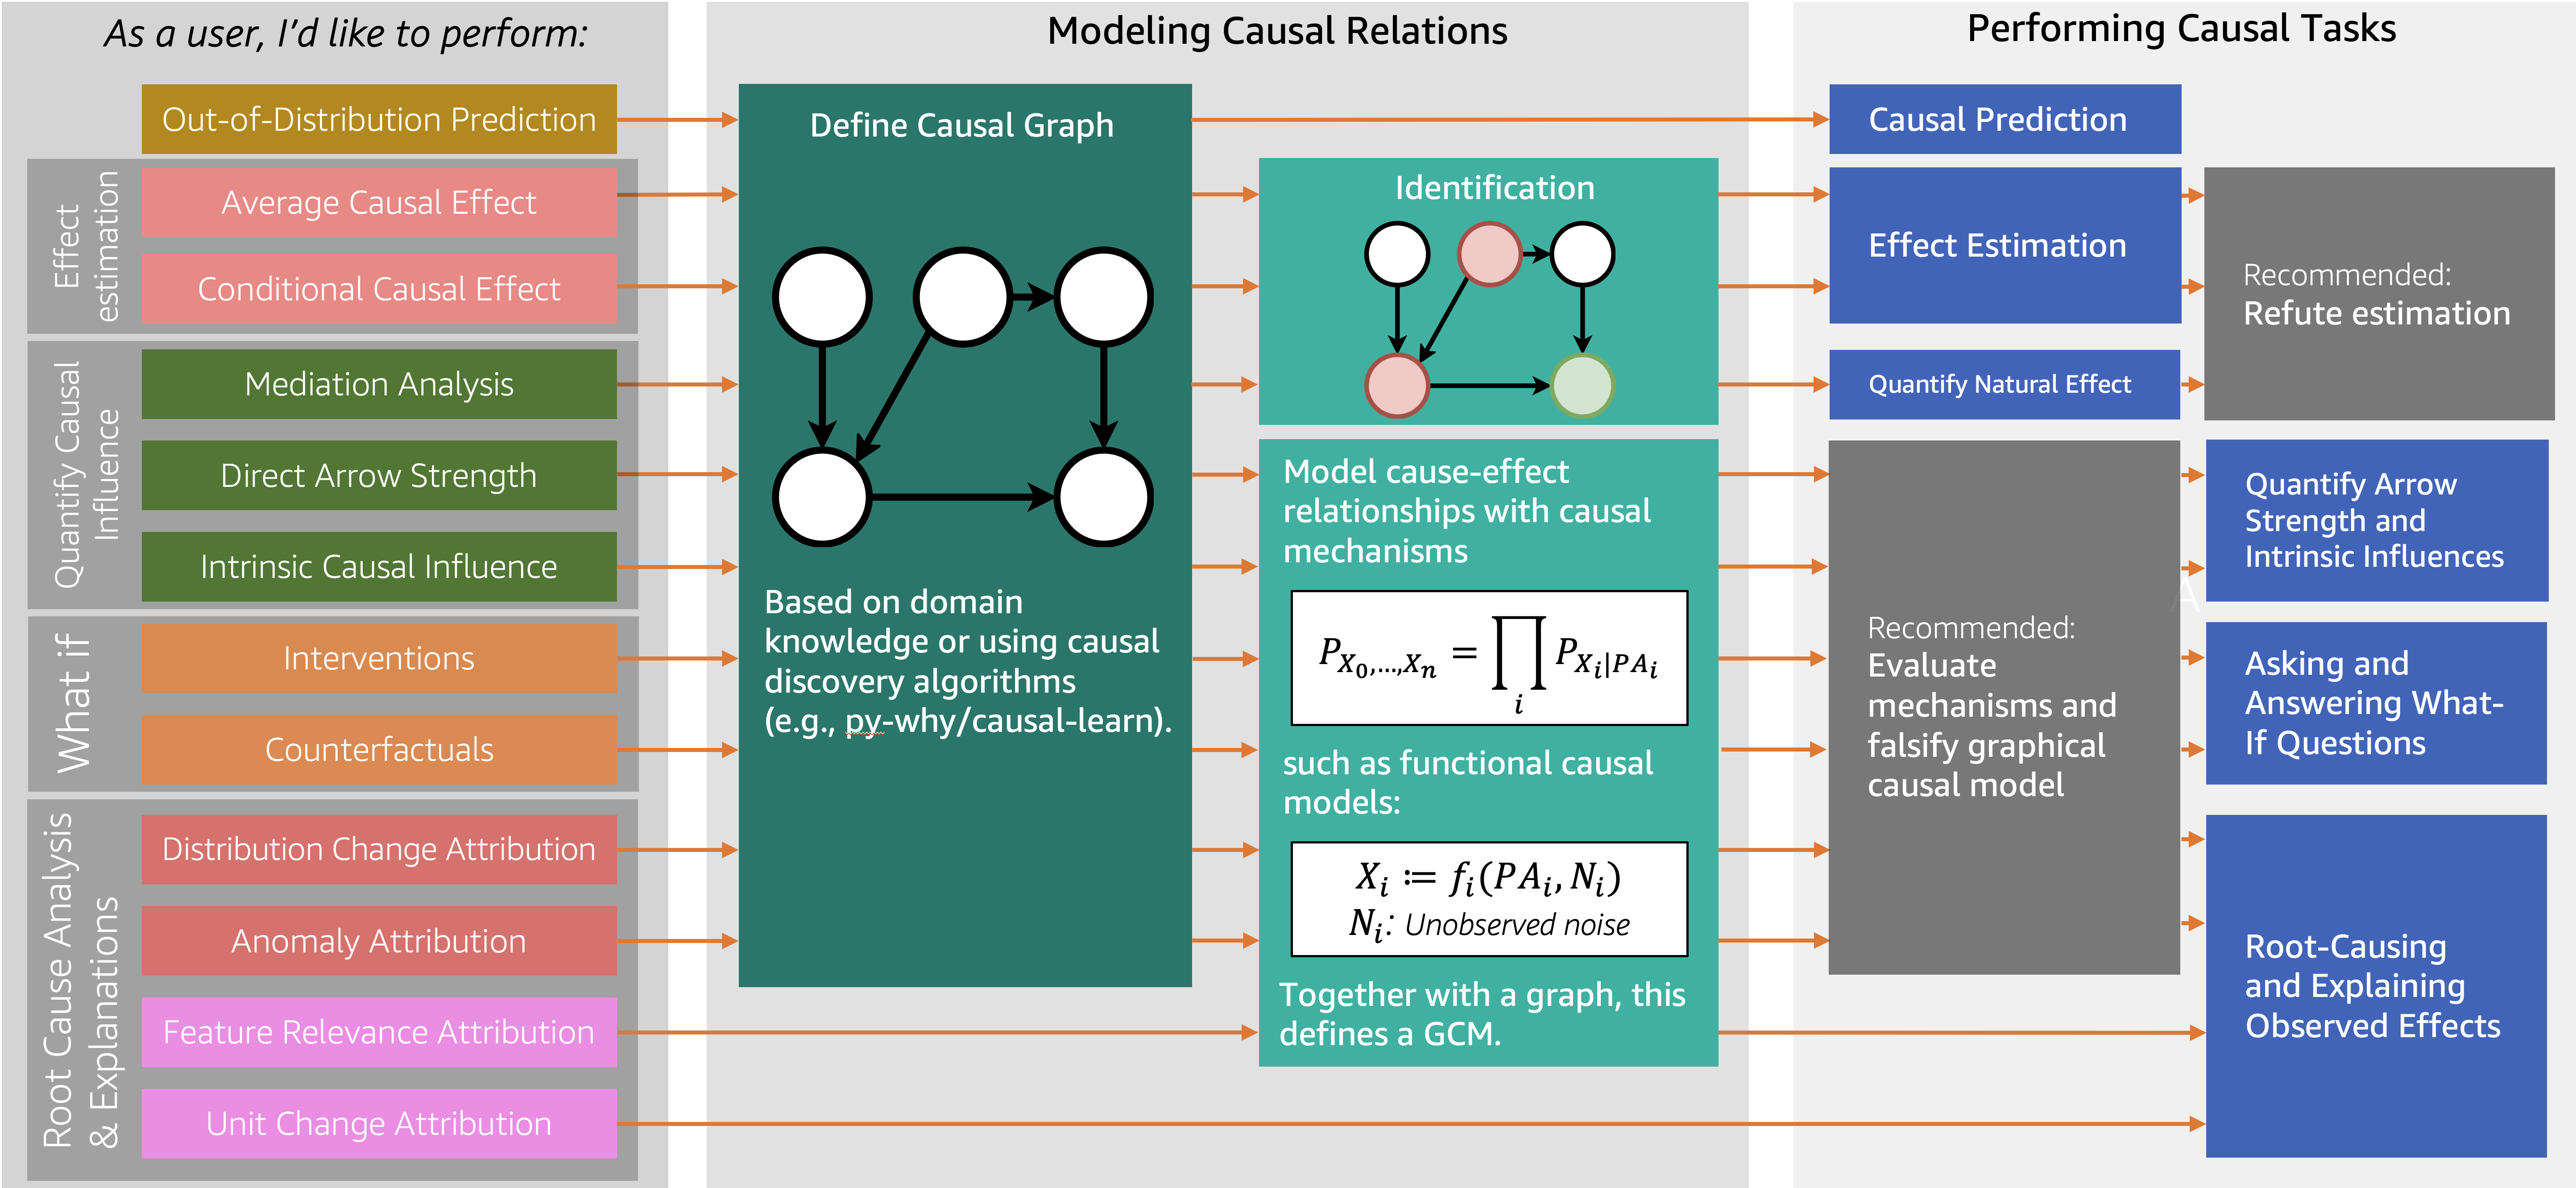
DoWhy effectively supports causal inference by integrating the two major concepts of causal graphical models and potential outcomes. It directly supports the following tasks:
- Effect estimation: Identification of causal effects, average/conditional causal effects, instrumental variable usage, etc.
- Quantifying causal influence: Mediation analysis, direct path strength measurement, etc.
- What-if & counterfactual analysis: Distribution intervention, counterfactual ('what if...?') analysis
- Root cause analysis and explanation: Tracing causes of anomalies, evaluating causal importance of features, etc.
The assumption validation (refutation & falsification) API is a major advantage even for beginners, allowing direct testing of result reliability.
"DoWhy combines assumption validation capabilities with all estimation methods, making inference more practical and trustworthy."
4. Installation and Getting Started
Installation Methods
Supporting Python 3.8+, it can be installed very simply via pip, poetry, conda, and more.
- pip:
pip install dowhy - poetry:
poetry add dowhy - conda:
conda install -c conda-forge dowhy
For the latest development version, install directly from the GitHub repository:
pip install git+https://github.com/py-why/dowhy@main
Additional packages and installation tips For better graph input/visualization, you can separately install pydot or pygraphviz. On Ubuntu:
sudo apt install graphviz libgraphviz-dev graphviz-dev pkg-config
pip install --global-option=build_ext \
--global-option="-I/usr/local/include/graphviz/" \
--global-option="-L/usr/local/lib/graphviz" pygraphviz
If you encounter issues, refer to the official pygraphviz installation guide.
5. Quick Examples: Causal Effect Estimation and Graph-Based Analysis
1) Basic Flow of Causal Effect Estimation
With just four steps, you can perform causal estimation using data:
- Model creation: Define the causal graph based on data for modeling
- Effect identification: Identify conditions and variables for deriving effects from the causal graph
- Effect estimation: Use statistical/ML methods to actually estimate effects
- Result refutation: Verify result reliability through tests like adding random variables
from dowhy import CausalModel
import dowhy.datasets
# Load data
data = dowhy.datasets.linear_dataset(
beta=10,
num_common_causes=5,
num_instruments=2,
num_samples=10000,
treatment_is_binary=True)
# 1. Create causal model
model = CausalModel(
data=data["df"],
treatment=data["treatment_name"],
outcome=data["outcome_name"],
graph=data["gml_graph"]) # or use nx.DiGraph
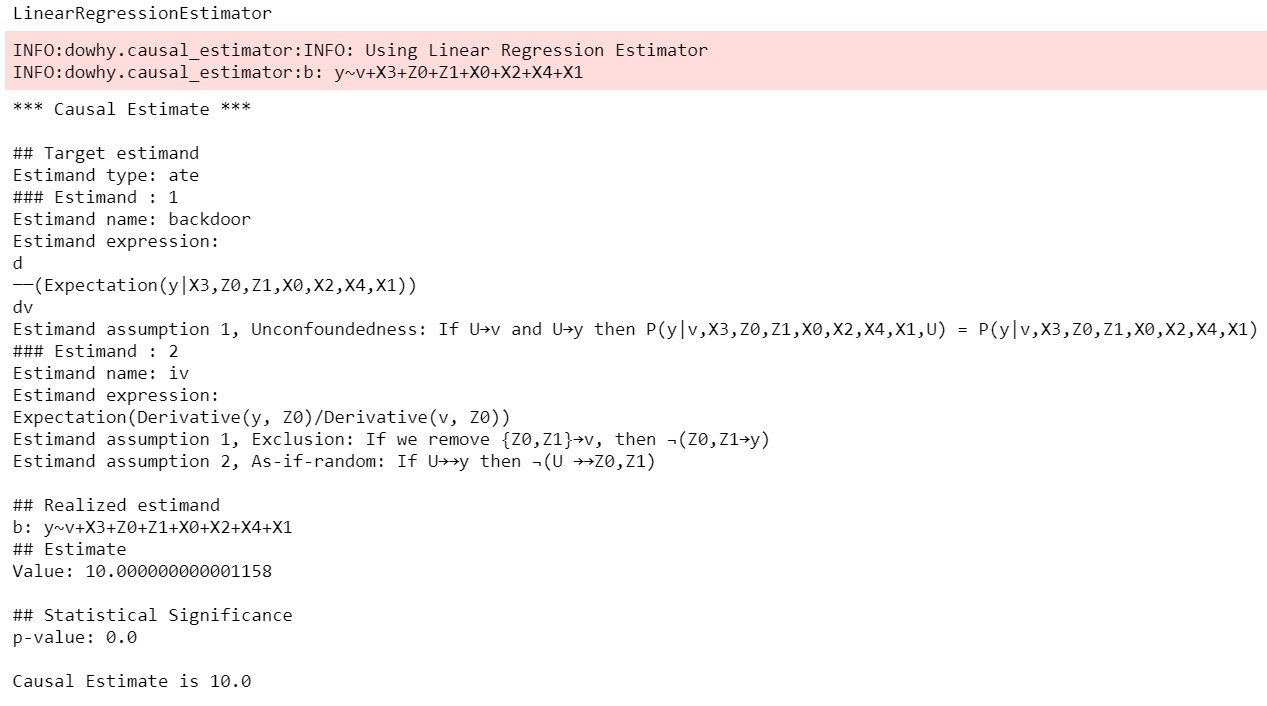
# 2. Identify effect
identified_estimand = model.identify_effect()
# 3. Estimate effect
estimate = model.estimate_effect(identified_estimand, method_name="backdoor.propensity_score_matching")
# 4. Refute result
refute_results = model.refute_estimate(identified_estimand, estimate, method_name="random_common_cause")
DoWhy's output allows you to directly inspect assumptions, identified causal effects, and estimated values at each step.
- More examples: Getting Started with DoWhy
- Conditional Average Treatment Effect (CATE) examples using the EconML library are also available in the official notebooks.
2) Graph-Based Modeling (GCM) and Root Cause Analysis
Using DoWhy-GCM based on Pearl's Structural Causal Model framework enables complex root cause analysis and scenario simulation. For example, you can create a simple X->Y->Z structure and trace back the cause of anomalous Z values.
import networkx as nx, numpy as np, pandas as pd
from dowhy import gcm

# 1. Generate data and define structural causal model
data = pd.DataFrame(dict(
    X=np.random.normal(loc=0, scale=1, size=1000),
    Y=2 * X + np.random.normal(loc=0, scale=1, size=1000),
    Z=3 * Y + np.random.normal(loc=0, scale=1, size=1000),
))
causal_model = gcm.StructuralCausalModel(nx.DiGraph([('X','Y'), ('Y','Z')])) # X->Y->Z connection
gcm.auto.assign_causal_mechanisms(causal_model, data)

# 2. Fit model
gcm.fit(causal_model, data)

# 3. Analyze where the anomalous Z value originates
anomalous_sample = pd.DataFrame(dict(X=[0.1], Y=[6.2], Z=[19]))  # anomalous value
anomaly_attribution = gcm.attribute_anomalies(causal_model, "Z", anomalous_sample)
- More use cases and examples: Online Shop example, User Guide
6. Reference Materials and Additional Information
- Microsoft Research Blog: DoWhy introduction
- Tutorial videos
- Related papers
- Slides: Slideshare
- Contributing/Issues/Contact
"If DoWhy is useful for your research or work, please be sure to cite both papers below."
7. Citation Information
@article{dowhy,
  title={DoWhy: An End-to-End Library for Causal Inference},
  author={Sharma, Amit and Kiciman, Emre},
  journal={arXiv preprint arXiv:2011.04216},
  year={2020}
}
@article{JMLR:v25:22-1258,
author  = {Patrick Bl{{"o}}baum and Peter G{"o}tz and Kailash Budhathoki and Atalanti A. Mastakouri and Dominik Janzing},
title   = {DoWhy-GCM: An Extension of DoWhy for Causal Inference in Graphical Causal Models},
journal = {Journal of Machine Learning Research},
year    = {2024},
volume  = {25},
number  = {147},
pages   = {1--7},
url     = {http://jmlr.org/papers/v25/22-1258.html}
}
Final Thoughts
DoWhy is an excellent tool for anyone seeking to perform causal inference in an easy, transparent, and reliable manner. As it helps data analysis focus on the essential question of 'why,' it's highly recommended for anyone wanting to try causal analysis! Feel free to ask questions in the community anytime.