This article explains how to apply causal inference beyond prediction models to the hotel booking cancellation problem. Specifically, it aims to uncover how assigning a guest a room different from their booking affects cancellation. Going beyond simply observing correlations, it uses the DoWhy tool to model and validate causal relationships in data through a detailed 4-step process.
1. Problem Definition and Data Introduction
We want to understand the impact on booking cancellation when guests are assigned a room different from their reservation. The most ideal way to solve this is through Randomized Controlled Trials (RCT), like A/B testing. Each guest would be randomly assigned to one of two groups: one receiving the same room as booked, and the other receiving a different room.
However, in reality, conducting such experiments is often difficult. For example, if a hotel becomes known for randomly assigning different rooms, its reputation could suffer. Additionally, experimentation costs can be substantial.
"A Randomized Controlled Trial (RCT) is an experimental form of impact evaluation in which the population receiving the program or policy intervention is chosen at random from the eligible population, and a control group is also chosen at random from the same eligible population." – UNICEF
Therefore, the author focuses on whether we can answer such questions using only previously collected observational data.
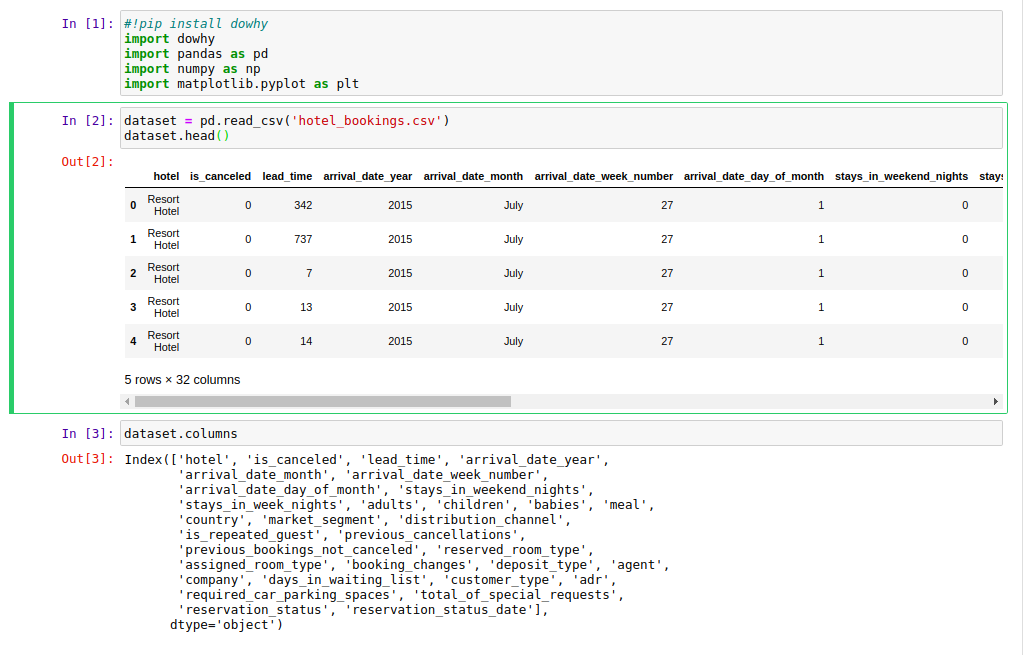
1.1. Dataset Description
The dataset used in this analysis is booking information collected from actual Portuguese hotels (city hotels and resort hotels). It includes various information such as booking time, length of stay, number of adults/children/infants, and available parking spaces. All personally identifiable information has been removed. This data comes from the paper "Hotel Booking Demand Datasets" by Antonio et al. (2019), and more details can be found here.
For reference, if you're interested in building a predictive model to predict booking cancellation using this dataset, check out the author's previous notebook which focuses primarily on exploratory data analysis (EDA) and model building.
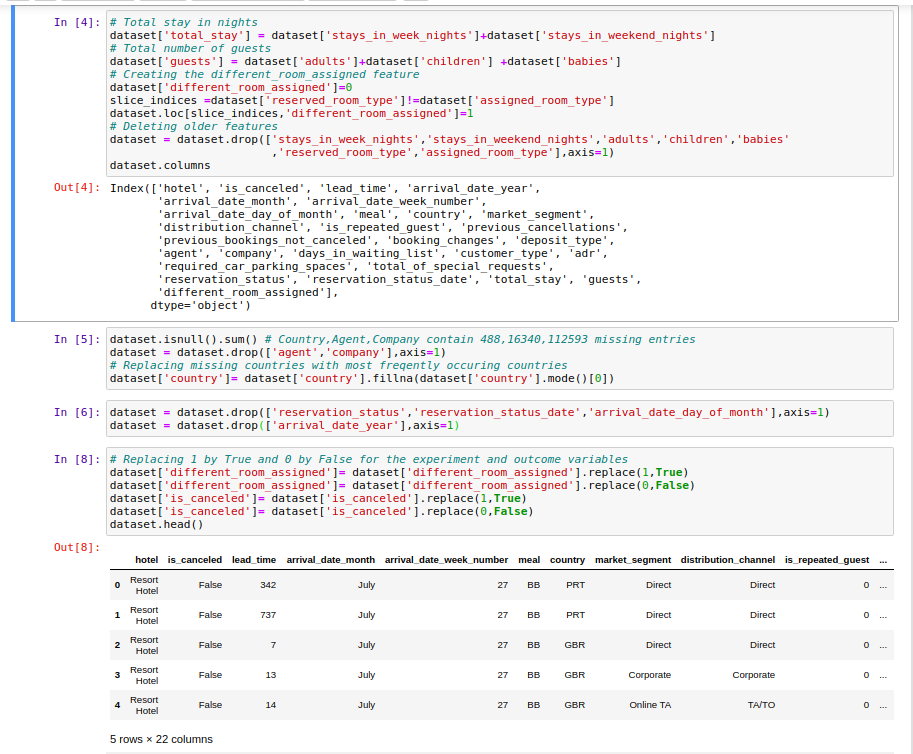
2. Feature Engineering and Preprocessing
Before analyzing the data, several new features were created and preprocessing was performed to reduce the dataset's dimensionality and extract meaningful information.
The following new features were created:
- Total Stay =
stays_in_weekend_nights+stays_in_week_nights - Guests =
adults+children+babies - Different_room_assigned = 1 if
reserved_room_typediffers fromassigned_room_type, 0 otherwise.
3. Expected Frequency Calculation and Exploring Confounding Variables
Since cancellation counts and different room assignment counts are highly imbalanced, we calculated expected counts.
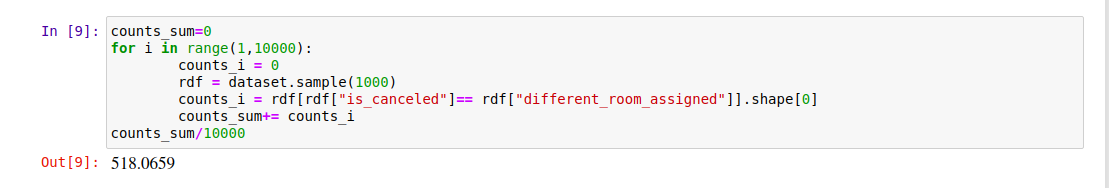
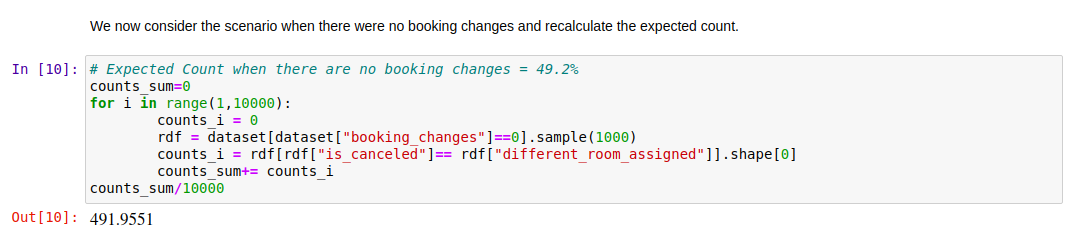
The initially calculated expected frequency was about 50%, meaning the probability that two variables (cancellation status and different room assignment) randomly share the same value. Statistically, no definitive conclusion could be drawn at this stage.
So we recalculated expected frequencies taking Booking Changes into account.
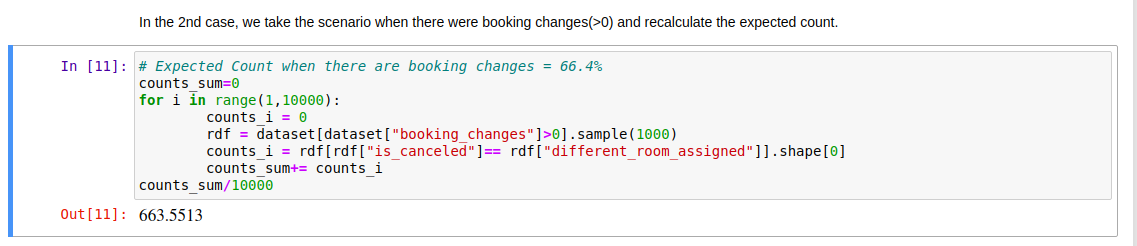
A clear change appeared when booking changes were non-zero. This suggests that Booking Changes could be a confounding variable.
But is Booking Changes the only confounder? What if there are unobserved confounders not in the dataset? Can we still make the same claims? This is where DoWhy comes in!
4. The Causal Inference Process Using DoWhy
DoWhy focuses on the assumptions needed for causal inference and provides estimation methods like matching and instrumental variables (IV). This allows users to focus more on explicitly identifying assumptions using Causal Graphical Models.
Key features of DoWhy include:
- Input: Observational data and a causal graph. The causal graph must clearly specify treatment variables, covariates, and outcome variables.
- Output: Causal effects between desired variables and "What-if" analysis — the highest rung of the Ladder of Causation.
Causal inference using DoWhy proceeds through 4 major steps.
4.1. Step 1: Goal Setting and Problem Formulation
Our goal is to estimate how assigning a room different from the booking affects booking cancellation. As mentioned, RCTs are ideal but may be infeasible or costly in practice due to reputation concerns or unethical situations (e.g., assigning a 2-person room to a family of 6).
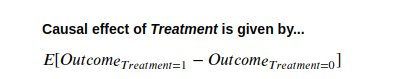
"We say that Treatment is a cause of Outcome. This means that changing the Treatment leads to a change in the Outcome while keeping everything else constant. The causal effect is the magnitude by which the Outcome changes per unit change in Treatment."
4.2. Step 2: Creating the Causal Model
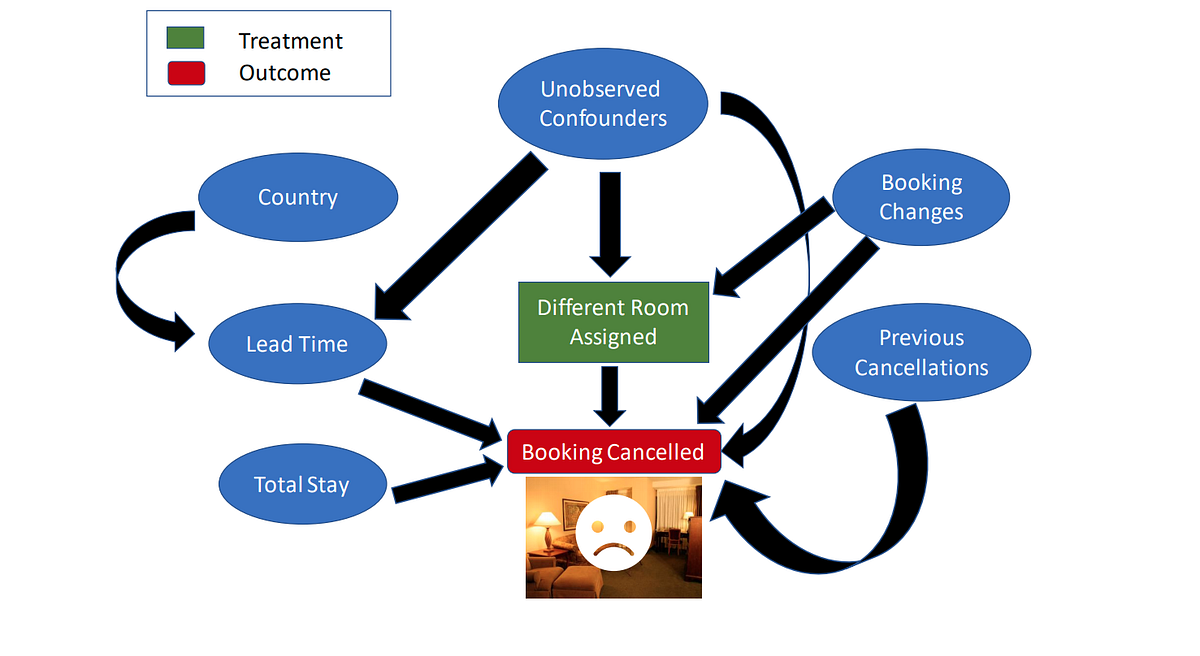
In this step, prior knowledge about the predictive modeling problem is expressed as a Causal Graph. You don't need a perfect graph from the start — even a partial graph allows DoWhy to figure out the rest. The causal model the author considered is shown in Fig-2.
The assumptions translated into a causal diagram include:
- Market Segment: Divided into "TA" (Travel Agent) and "TO" (Tour Operator), affecting Lead Time (days from booking to arrival).
- Country: May influence whether individuals book early (longer Lead Time) and their preferred Meal type.
- Lead Time: Affects Days in Waitlist (later bookings are less likely to find availability) and longer lead times may lead to cancellation.
- Days in Waitlist, Total Stay, Guests: May influence whether bookings are cancelled or maintained.
- Previous Booking Retentions: Influences whether a guest is a Repeated Guest, and both variables affect booking cancellation (e.g., a guest who maintained 5 past bookings is likely to maintain this one too).
- Booking Changes: Influences whether a guest gets a different room, which may also lead to cancellation.
- Unobserved Confounders: It's unlikely that Booking Changes is the only confounder affecting both treatment and outcome, so we assume unobserved confounders may exist beyond the data.
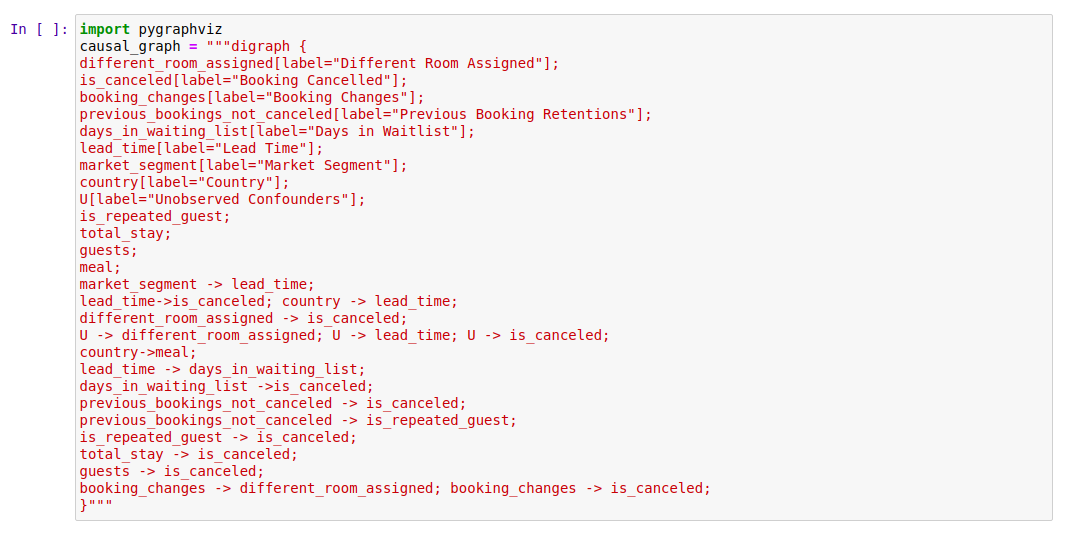
Here, Treatment is assigning the guest the same type of room as booked, and Outcome is whether the booking was cancelled. Common Causes represent variables that causally influence both outcome and treatment according to our causal assumptions. Per our assumptions, the two variables meeting this criterion are Booking Changes and Unobserved Confounders.
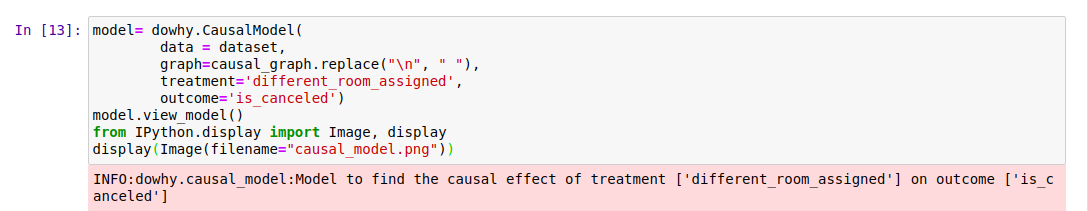
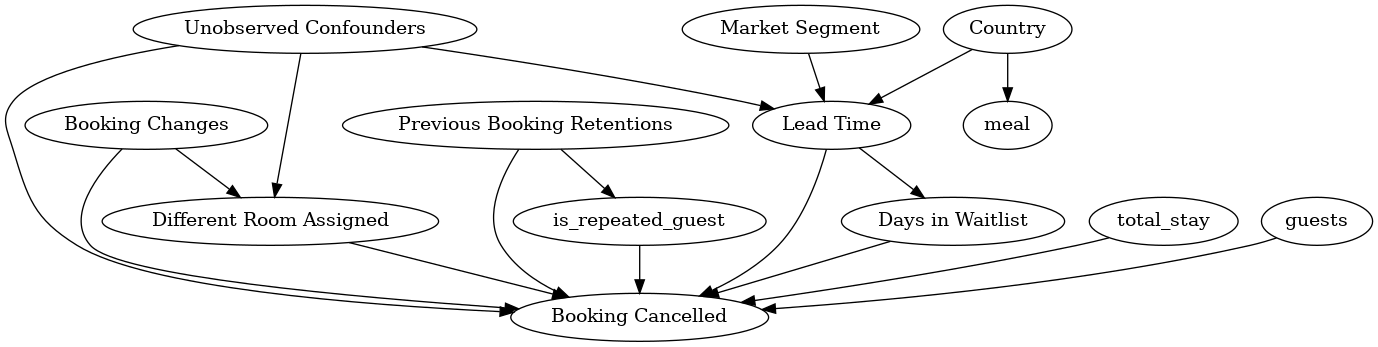
Fig-2: Causal assumptions specified through a simple graphical model.
The author adds that a more detailed causal diagram like Fig-3 could also be considered based on intuition and assumptions.
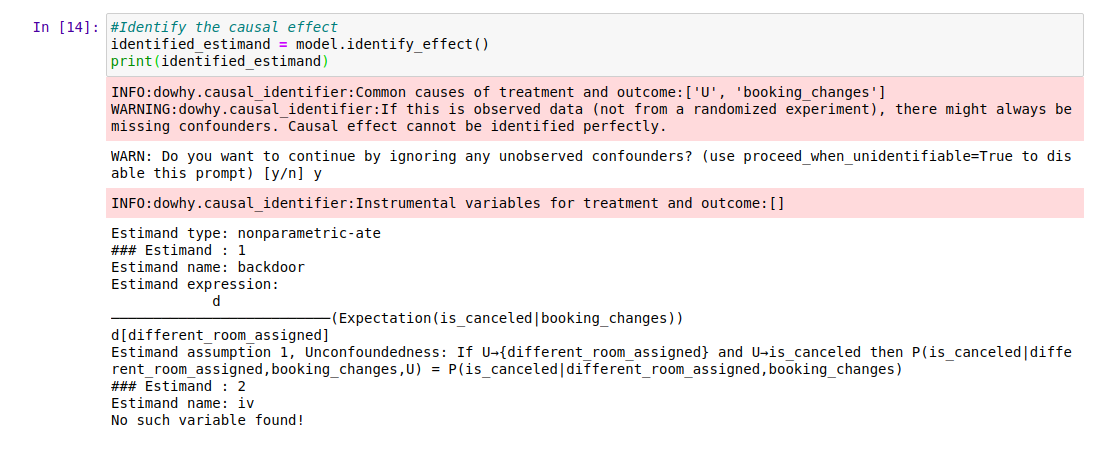
4.3. Step 3: Identifying the Causal Effect
In this step, properties of the causal graph are used to identify the causal effect to be estimated.
"We say that Treatment is a cause of Outcome when changing the Treatment leads to a change in the Outcome while keeping everything else constant."
"Keeping everything else constant" can be understood by imagining a counterfactual world. In this world, everything was identical up to the point of treatment introduction, but in the 'real' world, treatment was given, while in the 'counterfactual' world, it wasn't. Thus, any change in Outcome we observe can be attributed solely to the Treatment.
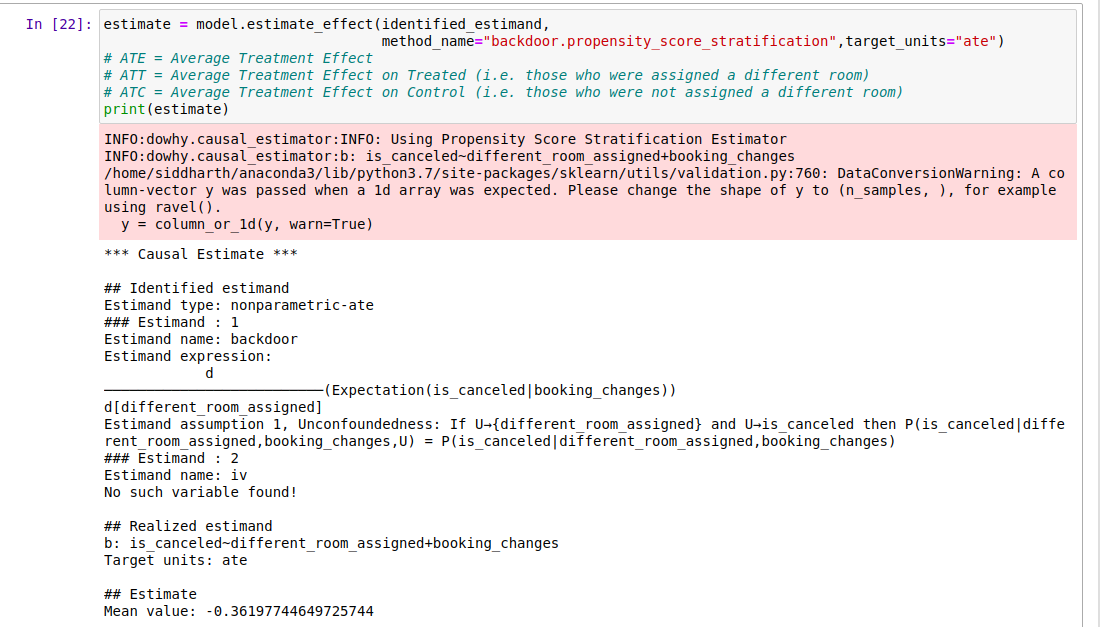
4.4. Step 4: Estimating the Identified Causal Effect
The causal effect is the magnitude by which the Outcome changes per unit change in Treatment. Estimation is a statistical procedure, making it relatively straightforward compared to other steps. DoWhy provides several methods for computing identified causal estimates.
In this example, the Propensity Score Stratification Estimator was used. Propensity scores measure the tendency of an observation to be treated and must be estimated or modeled from data. These scores are computed by training machine learning classifiers like logistic regression or random forests to predict the treatment variable given covariates. Stratification is a technique for identifying matched subpopulations with similar covariate distributions.
For proper explanations of these methods, see the tutorial provided by DoWhy developers at KDD'18.
4.5. Step 5: Refuting the Results (Validation)
The causal part doesn't come from data but from the assumptions (Step 1) used to identify (Step 2) and estimate (Step 3) causes. Data is simply used for statistical estimation.
Therefore, verifying our assumptions and testing their validity through various methods is crucial. DoWhy provides several Robustness Checks for testing assumption validity:
-
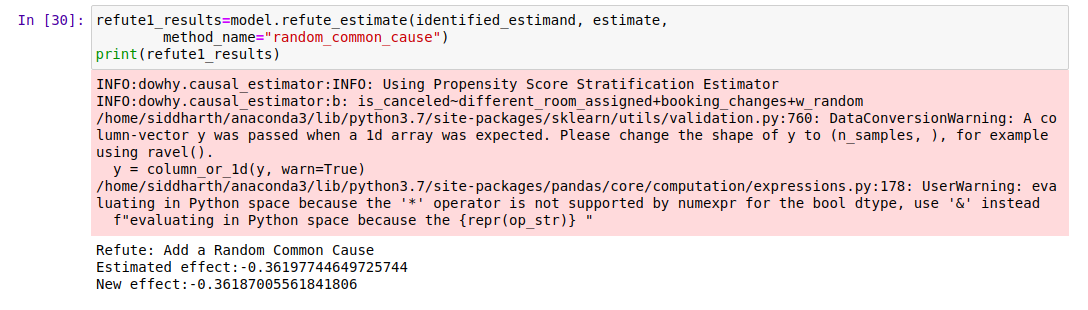
Random Common Cause: Add a randomly selected covariate to the data and rerun the analysis to check if the causal estimate changes. If original assumptions were correct, there should be no significant change.
-
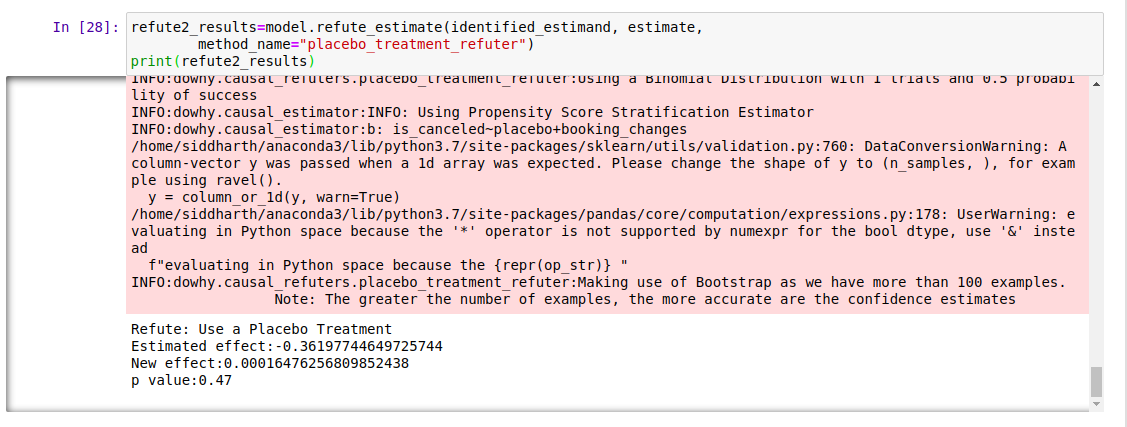
Placebo Treatment Refuter: Designate an arbitrary covariate as the treatment variable and rerun the analysis. If assumptions were correct, the newly found estimate should converge to 0.
-
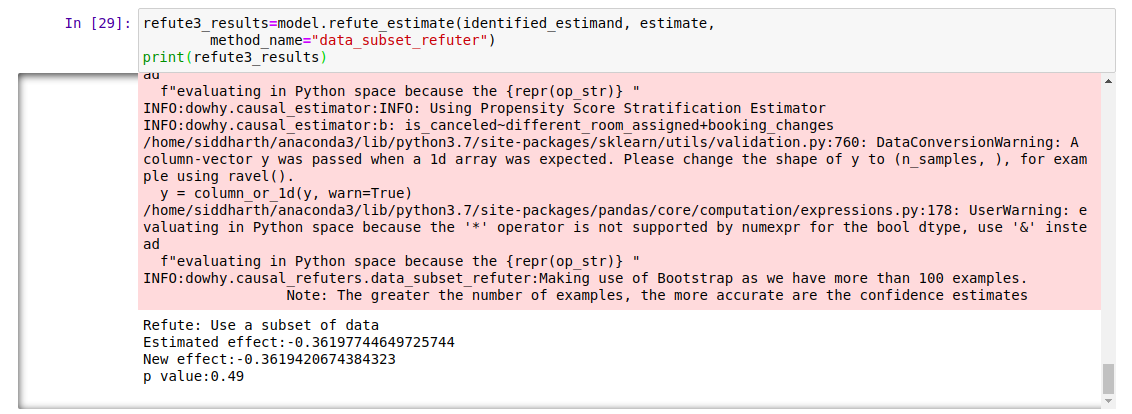
Data Subset Refuter: Create data subsets (similar to cross-validation) and check if causal estimates vary across subsets. If assumptions were correct, there should be no significant change.
Through multiple robustness checks, we verified that our causal assumptions were indeed correct!
The analysis results show that, on average, when guests are assigned the same room they booked, the probability of hotel booking cancellation decreases by approximately 36% compared to when a different room is assigned.
Therefore, when hotel staff face difficult situations requiring room reassignment, they now understand how significantly their actions impact booking cancellation!
5. Bonus Tips: Causal Inference Best Practices
Here are some best practices to follow when performing causal inference with observational data:
- Always follow the four steps of model, identify, estimate, refute.
- Aim for simplicity. If the analysis is too complex, it's most likely wrong!
- Try at least 2 methods with different assumptions. If both agree, confidence in the estimate increases.
Final Thoughts
This article demonstrates an important journey of exploring causal relationships beyond simple prediction for the hotel booking cancellation problem. Using the DoWhy framework and following the systematic process of assumption-identification-estimation-refutation, it draws the important causal conclusion that assigning a room different from the booking increases cancellation rates by approximately 36%. This greatly helps hotel operators understand the real-world impact of actions that prediction models alone couldn't reveal. Causal inference proves once again to be a powerful tool for making wiser decisions in complex real-world problems.