A metric tree is a logical hierarchical structure that operationally connects business, team, and product strategy, clearly showing how individual small metrics influence the key target metric (North Star Metric). This article walks through the structure and necessity of metric trees step by step, covering how to build them, how to avoid misguided metrics, and real e-commerce examples. It is a powerful tool that helps anyone in the organization clearly connect strategy to execution, and also covers differences from KPI dashboards and frequently asked questions.
1. What Is a Metric Tree? A Map for Business Growth and Strategy
A metric tree refers to the logical hierarchical structure of a business growth model. It allows you to see at a glance how each metric influences the others, from granular metrics (e.g., marketing campaign performance, feature engagement rate) up to the North Star Metric (the ultimate target metric) that guides the entire team.
For a long time, many product teams have used the North Star Metric (NSM) as the central axis of their growth strategy. This is a metric that quantifies "the customer value the organization truly pursues," getting everyone focused in the same direction.
"If the North Star is a compass, the metric tree is a map. A compass points to the goal, but a map guides you specifically on where and how to move."
Beyond the existing North Star metric framework that stops at "what" and "why," the practical execution stage often misses the specifics of 'how' to proceed -- and this is exactly where the metric tree fills the gap.
2. Problems Metric Trees Solve and Their Advantages
Individual teams or team members within an organization typically manage input metrics such as "campaign performance" or "customer support response time" separately. These metrics are indirectly connected to the overall health and growth of the organization, but looking at each one alone makes it difficult to understand the overall flow.
Conversely, the North Star Metric (focus metric) shows the overall organization's performance, but it is difficult to understand why a particular phenomenon occurred, and it is often measured "after the fact" (belatedly).
"Looking only at the focus metric tells you 'what happened,' but makes it hard to figure out 'why it happened.'"
The strength of a metric tree lies in connecting these two perspectives. Linking everyday small actions to overall strategic goals, it enables rapid identification of the causes driving change and leads to real-time decision-making.
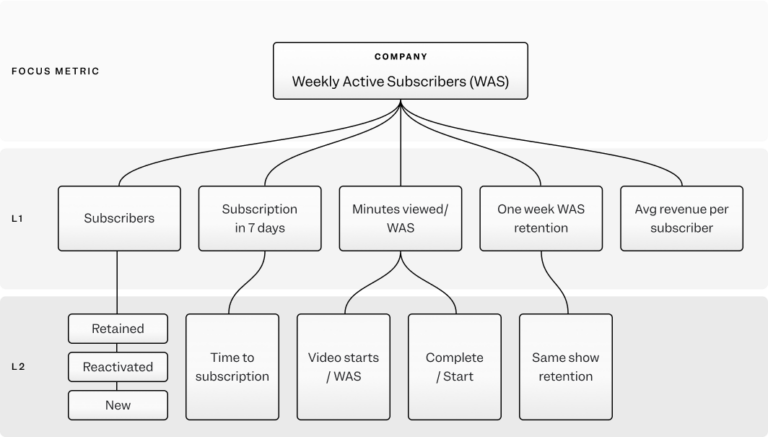
3. Metric Tree Structure and How to Build One
1. Define the North Star Metric (Focus Metric)
To build a metric tree, you must first determine the target metric that sits at the very top. This metric is typically a number directly tied to business outcomes such as revenue, growth, or user satisfaction.
"What do we want users to do?" Convert the answer to this question into time-based and usage-centric metrics. Example: For e-commerce, 'Weekly Active Buyers'
2. Design L1, L2, L3 Input Metrics
- L1 input metrics: Directly influence the focus metric
- L2 input metrics: Influence L1 metrics
- L3 input metrics: Influence L2 metrics
Each input metric should be identified by thinking about "What specific elements can our team (or role) contribute to the North Star?" and must be specific and measurable.
Input metrics (especially lower-level ones) can have multiple per pathway, and each metric should be clearly linked to who is responsible or which team owns it.
"Every measurable action must have a corresponding metric, and each must be linked to its responsible role (team)."
3. Relationships Between Metrics: Components and Influences
- Component relationships: Connected by clear formulas/equations Example: 'Revenue over period X = Number of users x Average revenue per user'
- Influence relationships: Related but difficult to calculate precisely. Example: 'Lead response speed' influences 'success rate,' but the exact extent is unknown.
4. Practical Application of Metric Trees and Data Management Principles
There are several core principles for effectively using metric trees in practice:
-
Real-time Self-serve Analytics
- Everyone should be able to check and analyze their area's data in real time, without the help of a data team.
-
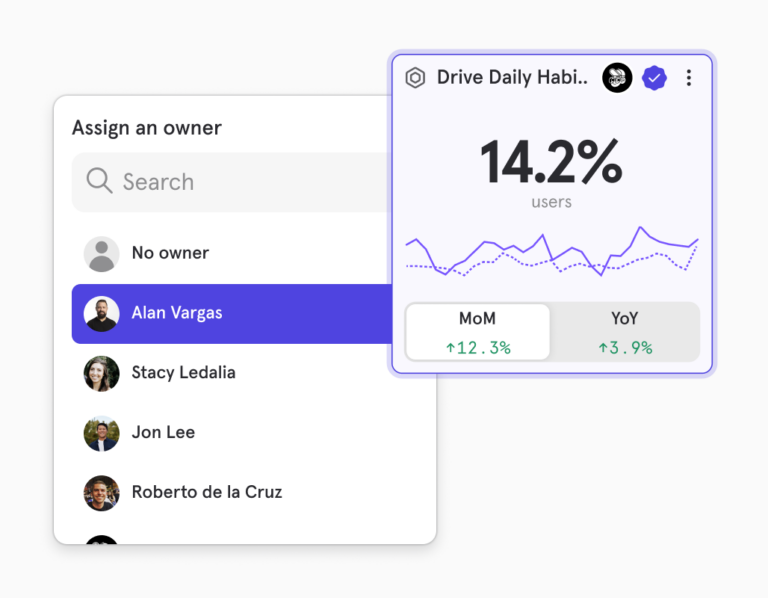
Assign an owner to each metric
- Every metric needs a designated owner to enable fast and accountable decision-making.
-
Link metrics to experiments/reports
- When a metric suddenly fluctuates, you must immediately investigate and respond using other reports, behavioral experiments, user feedback analysis, and more.
-
Data governance and action log maintenance (transparency + trust)
- Continuously record each metric's definition and calculation method, data quality management, actions taken and their rationale.
-
Continuously evolve metrics in line with business changes
- Periodically (quarterly recommended) revise and supplement the metric framework to reflect changes such as business expansion and new product launches.
"Whenever you need to change what you measure, your measurement framework (metric tree) must evolve alongside it."
5. Metric Tree Real-World Example: E-Commerce
Below is a metric tree built using an actual online clothing company as an example.
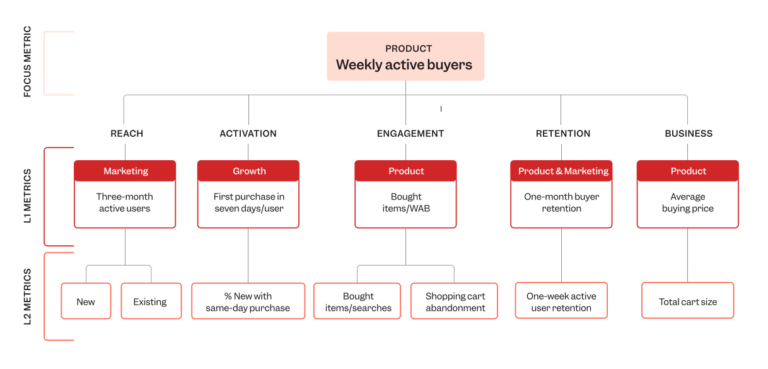
Key Structure and Explanation
- Weekly Active Buyers: Top-level focus metric (number of users who made a purchase)
- Reach: Users who searched/visited in the past 3 months (segmented into new/existing, reactivated/retained, etc.)
- Activation: Driving first purchase within 7 days for new users
- Engagement: Number of items purchased per person (driving multi-item carts)
- Retention: 1-month repurchase rate, 1-week revisit rate, etc.
- Business characteristics: Average purchase price (aim to lower it while increasing cart size)
This structure enables immediate identification and improvement of problem areas (e.g., increasing cart abandonment rate).
6. Differences from KPI Dashboards and Frequently Asked Questions
"How is a metric tree different from a KPI dashboard?"
- Metric tree: Centered on the strategic alignment of the entire organization/team and hierarchical impact structure. Clearly reveals through a tree structure how each action impacts higher-level metrics.
- KPI dashboard: Only shows the current status of various key metrics. It is difficult to see how metrics relate to each other or how they contribute to overall goals.
Frequently Asked Questions
- How often should a metric tree be updated?
- Remove obsolete metrics and add necessary new ones as strategy changes (quarterly, etc.).
- What tools are needed to build a metric tree?
- A digital analytics platform capable of data integration is essential.
- Can small teams use them?
- Yes! They are especially helpful for leadership buy-in, cross-team collaboration, and establishing execution priorities.
Conclusion
A metric tree is not just a list of numbers but rather an organizational 'map' where all actions and strategies are clearly connected. It helps everyone understand how daily small tasks lead to strategic goals and create real organizational results, reducing inefficient discussions and trial-and-error while driving fast and effective growth. Regardless of team size, it simultaneously provides a growth compass and map for team members.