Heart rate variability (HRV) is not simply about heart rate -- it highlights the fact that subtle variations between heartbeats provide diverse information about our health, emotions, and even behavior. This article provides an accessible summary of the key methods for analyzing HRV using ECG (electrocardiogram) data and what each method reveals. It serves as an essential guide for anyone interested in research or personal health management.
1. What Is Heart Rate Variability (HRV)?
Our heart is central to life, both metaphorically and medically. From age-old expressions like "heartfelt conversation" and "heart of gold," the heart in reality goes beyond a pumping function to serve as an important indicator reflecting our stress, emotions, and psychological state.
In recent years, advances in ECG (electrocardiogram) devices have led to HRV being widely used not only in medicine but also for measuring and studying a variety of human physiological states. What HRV represents is how much the time intervals between heartbeats vary.
"High HRV is a sign of health, meaning your heart can adapt well to various situations. Conversely, low HRV is one of the mortality predictors for several diseases."

2. What HRV Tells Us
HRV is not just a metric used in hospitals. Heart rate variability is deeply connected to psychological characteristics such as emotion, self-control, social skills, and stress coping ability.
- Higher HRV: Research shows greater ability to regulate oneself, stronger social skills, and better recovery from stressful situations.
- Lower HRV: Suggests higher levels of psychological stress or arousal.
"HRV goes beyond a simple health metric -- it is a window that reveals the level of psychological stress and arousal."
For this reason, HRV is frequently used alongside other biosignals in psychological experiments and behavioral research to examine people's internal responses.
3. Three Methods for Calculating and Analyzing HRV
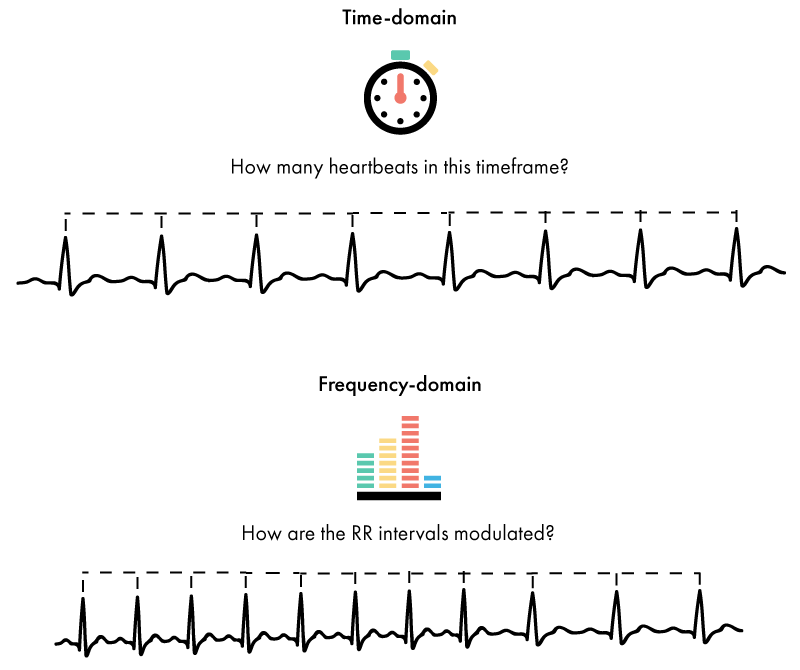
3.1 Time-Domain Methods
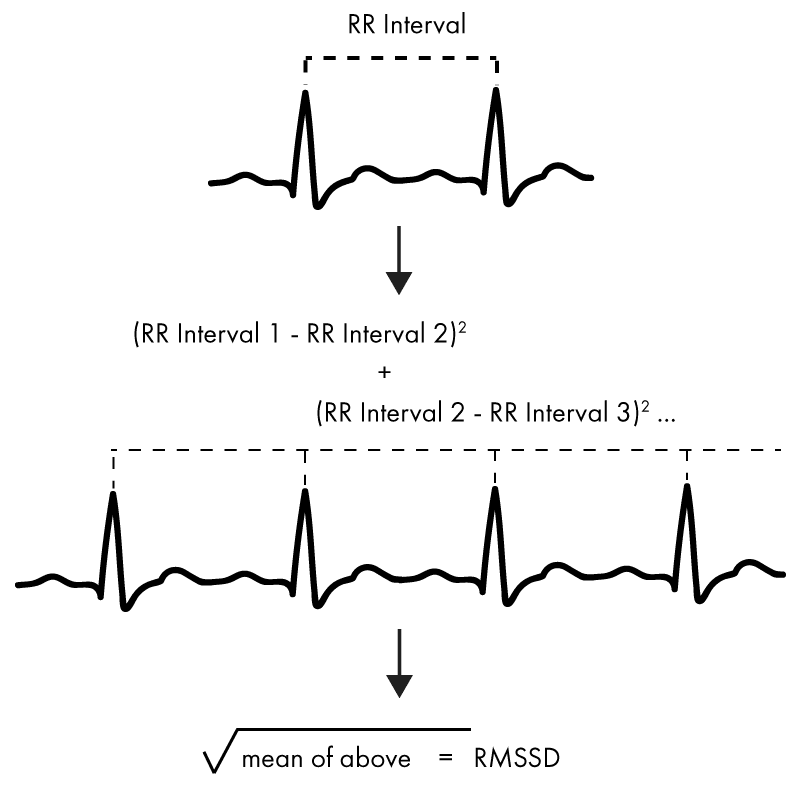
The most representative and widely used method is RMSSD. It calculates the square root of the mean of squared differences between successive heartbeat intervals (RR intervals), sensitively reflecting changes in parasympathetic nervous system activity.
"RMSSD is easy to calculate and handles large datasets well, making it the most commonly used metric in research settings."
Other time-domain metrics include SDNN (standard deviation of all RR intervals) and SDANN (standard deviation of the average RR intervals calculated over 5-minute segments).
3.2 Frequency-Domain Methods
This approach examines how the variations in heartbeat intervals are distributed across different frequency bands rather than over time.
- Low Frequency (LF, 0.04--0.15 Hz): Primarily associated with sympathetic nervous system activity
- High Frequency (HF, 0.15--0.4 Hz): Primarily associated with parasympathetic nervous system activity
- LF/HF Ratio: Frequently used as a measure of sympathetic/parasympathetic balance
"Frequency-domain analysis is similar to 'spectral analysis' in that it reveals how broadly the patterns of heartbeat variation are spread over time."
However, interpretation requires caution -- note that each frequency band is more related to autonomic nervous system regulatory patterns than to heart rate itself.
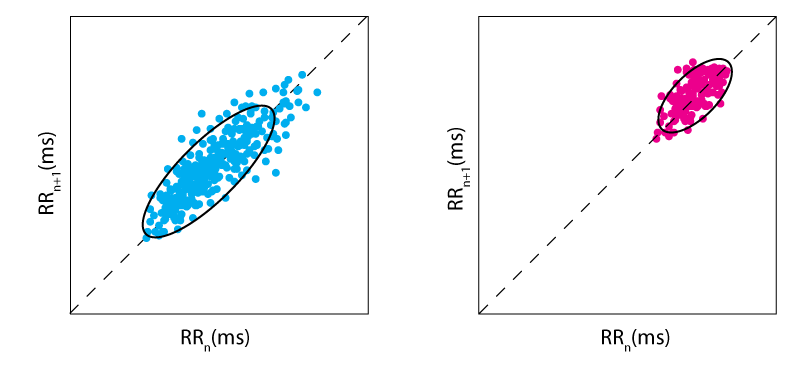
3.3 Poincare Plot
Beyond numbers alone, the Poincare plot is a visual tool that provides an intuitive view of heart rate variability.
This graph plots each RR interval against the next RR interval as a dot, showing the distribution pattern at a glance.
- Wider spread of dots = Higher HRV (healthier)
- Clustered dots = Lower HRV (stress, anxiety, disease)
"The Poincare plot allows you to assess HRV levels at a glance, providing tremendous visual assistance in clinical and research settings."
4. Analysis, Interpretation, and Application
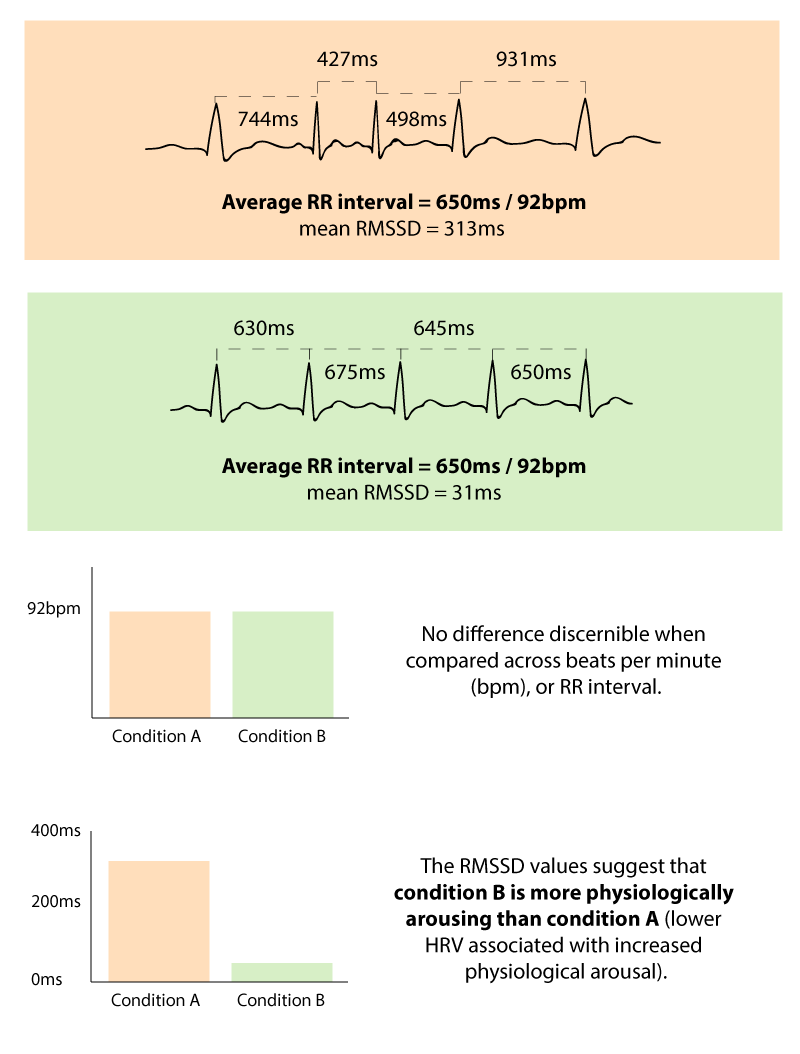
While the methods differ in approach, the key point is that they all ultimately represent the quantitative level of HRV. There are no standard HRV values yet, but relative comparisons between participants and much richer information than BPM (beats per minute) alone are possible.
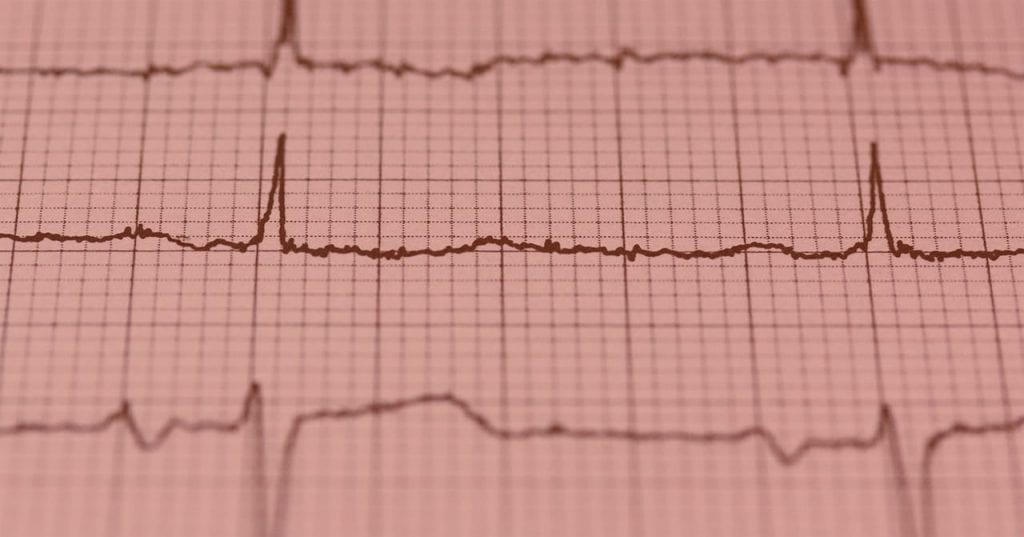
For example, the image below shows that even with the same BPM, RMSSD (heart rate variability) can differ significantly.
"When ECG is combined with other biosensors (e.g., facial expression analysis), it becomes possible to gain much deeper insights into emotion, arousal, and psychological and behavioral responses."
As of 2025, dedicated HRV software such as Kubios is widely used among researchers, offering the advantages of easy signal correction, visualization, detailed reports, and both time-domain and frequency-domain analysis of ECG data.
5. iMotions and ECG Research Support
iMotions provides end-to-end support for research, from recommending optimal equipment to setup and usage training, and data analysis. Its compatibility with Kubios and ability to integrate with various sensors make it particularly useful for those planning systematic research.
"If you have further questions, feel free to reach out at any time. We offer free consultations and neutral guidance."
Closing Thoughts
Heart rate variability is a rich window of information that reveals diverse aspects of our health, psychology, and behavior. By understanding and applying the right analysis methods, we can move beyond simple numbers to truly understand our bodies and minds. We hope this article helps resolve your questions about HRV and ECG data analysis, and brings you one step closer to research or health management.