This study, published in Scientific Reports in 2025, compared the effects of adjusting training intensity using a combination of heart rate variability (vmHRV), resting heart rate (RHR), and subjective wellbeing (WB) scores in experienced cyclists. The results showed that the group utilizing all three indicators achieved the most pronounced improvements in overall performance, including FTP (Functional Threshold Power), compared to groups using a single indicator. This suggests that an integrated approach considering both objective physiological data and subjective condition scores is the most effective method for enhancing training outcomes and preventing overtraining.
1. Research Background: The Tightrope Walk Between Training and Recovery
For athletes to improve their performance, they must apply sufficient stress to the body. But equally important is recovery. Without adequate recovery, continuous training can lead to the counterproductive state of overtraining. However, since every athlete differs in fitness and recovery capacity, it is extremely difficult to clearly identify the boundary between appropriate training and overtraining.
"Placing enough stress on the athlete primes the body for improvement, but such stress must be followed by periods of recovery to allow fitness adaptations to occur and to, importantly, avoid overtraining."
To monitor athlete status, researchers have employed various indicators. The most representative are heart rate variability (HRV), resting heart rate (RHR), and the athlete's self-reported wellbeing scores (WB). HRV in particular is widely used as a non-invasive indicator of autonomic nervous system status -- higher values indicate the body is in recovery mode (parasympathetic activation).
However, physiological indicators alone cannot fully capture psychological factors such as mood changes or sleep quality, and conversely, subjective feelings alone cannot accurately gauge actual physical fatigue. This study therefore sought to determine how much training outcomes differ when these indicators are combined.
2. Research Methods: Three Different Training Prescriptions
The research team recruited participants with cycling training experience through social media. Initially, 116 people applied, but due to injuries and personal circumstances causing dropouts, 28 experienced cyclists ultimately completed the study.
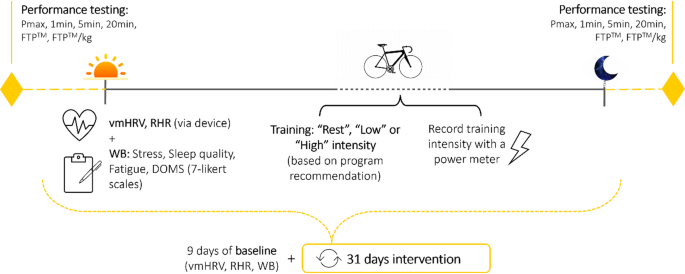
Participants engaged in the study for a total of 40 days: the first 9 days were spent training as usual to establish baseline data, followed by 31 days of training prescribed according to each group's assigned method.
Training Group Assignments
Participants were randomly assigned to one of three groups:
- Group 1 (vmHRV only): Training intensity adjusted solely based on heart rate variability (RMSSD) data.
- Group 2 (vmHRV + WB): Considered both heart rate variability and subjective wellbeing scores (fatigue, muscle soreness, stress, sleep).
- Group 3 (vmHRV + WB + RHR): Considered all three -- heart rate variability, wellbeing scores, and resting heart rate.
Procedure
Each morning upon waking, participants measured HRV and heart rate using an Oura Ring or chest strap, and entered their daily condition (wellbeing score) through an app. An algorithm would then recommend that day's training intensity as either "High," "Low," or "Rest."
 [Figure 1] Study procedure. After a 9-day baseline period, 31 days of individualized training intervention followed.
Performance tests were conducted on bikes equipped with power meters before and after the training period to measure changes in maximum power (Pmax), 1-minute/5-minute/20-minute maximum power, and FTP (the maximum power sustainable for one hour).
3. Research Results: Which Group Improved the Most?
After 31 days of training, the analysis of each group's performance yielded quite interesting results.
Performance Differences by Group
- Group 1 (HRV only): Surprisingly, no statistically significant performance improvement was found before and after training.
- Group 2 (HRV + WB): Showed significant improvements in 1-minute and 5-minute maximum power.
- Group 3 (HRV + WB + RHR): Produced the most outstanding results. Not only 5-minute and 20-minute power, but also the most important metric for cyclists -- FTP and FTP relative to body weight (FTP/kg) -- all improved significantly.
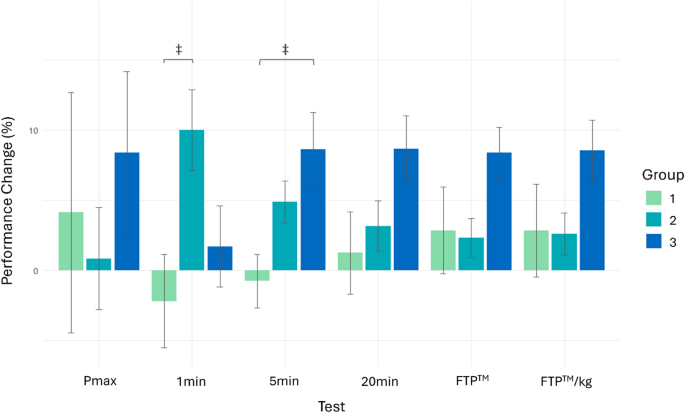 [Figure 2] Performance test change rates (%) by group. Group 3 (white bars) shows the most well-rounded improvement across the board.
Notably, in between-group comparisons, Groups 2 and 3 -- which incorporated wellbeing scores and heart rate -- recorded substantially larger gains in specific intervals (1-minute, 5-minute power, etc.) than Group 1, which used HRV alone.
4. Deep Data Analysis: The Mind-Body Connection
The research team also examined the relationship between physiological and psychological indicators using the data collected daily.
Correlations Between Indicators
In most participants, heart rate variability (HRV) and resting heart rate (RHR) showed a strong negative correlation (higher HRV meant lower heart rate). This was expected. However, no clear correlation was found between HRV and subjective wellbeing (fatigue, muscle soreness, etc.).
What does this mean? "The body's physiological recovery state (HRV) and how you subjectively feel (WB) don't always match." That's why both need to be measured separately and combined to understand an athlete's true condition.
Data Consistency (Autocorrelation Analysis)
When analyzing how consistent the daily data was (how similar today's values were to yesterday's), "Stress" showed the highest consistency. In contrast, muscle soreness (DOMS), wellbeing scores, and heart rate exhibited greater variability.
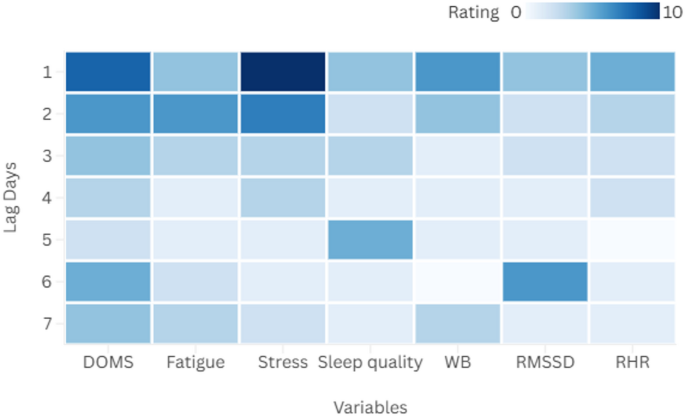 [Figure 3] Daily autocorrelation heatmap by variable. Darker colors indicate higher correlation with the previous day's values. Notice that Stress shows the darkest color.
5. Discussion: Why Is "Integration" the Answer?
The core finding of this study is that "the more indicators you combine, the more powerful the result." Why is that?
The Role of Subjective Wellbeing (WB)
Heart rate data (HRV) alone cannot tell you whether you slept well, whether your muscles are sore, or how you're feeling today. The research team explained that wellbeing scores served as context for the HRV data. For example, even if HRV readings were good, if an athlete reported "I'm exhausted," lowering the training intensity could prevent injury and enable higher-quality training.
"Physiological markers like RHR cannot inform of all aspects of fatigue or performance."
The Added Benefit of Resting Heart Rate (RHR)
The reason Group 3 achieved the best results may be that adding RHR helped compensate for "HRV saturation." Elite athletes sometimes maintain high HRV even when training volume is heavy, making it difficult to determine from HRV alone whether fatigue is accumulating. When heart rate data is also considered, one can identify situations like "HRV is high but heart rate is also high -- this might indicate fatigue accumulation rather than recovery."
Limitations
Of course, there were limitations. Many participants dropped out during the study, resulting in a small final sample (28), and there were very few female participants, making gender-based analysis difficult. Additionally, since participants performed training autonomously, experimental control was not perfect.
Conclusion
In summary, for cyclists and endurance athletes in 2025 who want to maximize training effectiveness, rather than relying solely on a single HRV reading from a smartwatch, they should comprehensively consider their morning heart rate along with their subjective condition (sleep quality, muscle soreness, etc.).
This study scientifically demonstrated that when we harmoniously leverage the "objective data" measured by machines and the "subjective feelings" communicated by our bodies, we can run healthier and faster.