This paper introduces a continuous heart rate variability (HRV) and sleep diary dataset collected over four weeks from 49 healthy participants using smartwatches. Gathered in real-world daily life rather than laboratory settings, this dataset is a valuable resource for analyzing connections between physical activity, sleep patterns, and mental health indicators such as depression and insomnia. The research team hopes this data will drive the development of new healthcare applications and AI-based mental health prediction research.
1. Research Background: Why Is This Data Needed?
Wearable devices like smartwatches have become widely popular. They go far beyond counting steps, serving as powerful tools for 24/7 monitoring of health information such as sleep patterns and stress levels. Research continues to show that wrist-worn wearables are effective for monitoring post-traumatic stress symptoms, blood pressure, and metabolic activity.
Their role in mental health is also growing. For example, sleep duration and consistency measured by smartwatches are closely correlated with mood changes and depression scores. Poor sleep can lead to increased anxiety and depression, and even contribute to obesity and muscle loss.
One of the most important metrics here is heart rate variability (HRV). HRV measures the irregularity of intervals between heartbeats and serves as a critical signal indicating how well our autonomic nervous system is functioning.
Continuous monitoring of HRV is therefore a potentially valuable indicator of human health. However, most research to date has relied on short-term (e.g., 5-minute) HRV measurements obtained in clinical settings.
Previous studies typically measured HRV briefly in controlled hospital environments or conducted single 24-hour measurements. But our physical state and mood fluctuate throughout the day.
Due to this variability, a single measurement cannot accurately assess HRV. Daily continuous HRV assessment is therefore essential for analyzing long-term changes, but progress in this area has been limited -- partly due to the lack of publicly available datasets of in-situ HRV measurements.
This is why the research team created and publicly released this rich dataset of biosignals, sleep records, and mental health surveys collected continuously over four weeks in real-world (in-situ) settings.
2. Data Collection Methods
Smartwatch Meets Dedicated App
The team chose the Samsung Galaxy Watch Active 2 for data collection because it provides good access to raw data and allows measurement frequency to be adjusted through apps. They developed a dedicated app called 'Heart+' and distributed it to participants.
The app was configured to collect PPG (photoplethysmography) signals at 10Hz (10 times per second), balancing battery life with analytical accuracy. This was the optimal setting for measuring heart rate while enabling 24/7 monitoring over four weeks.
The Four-Week Journey
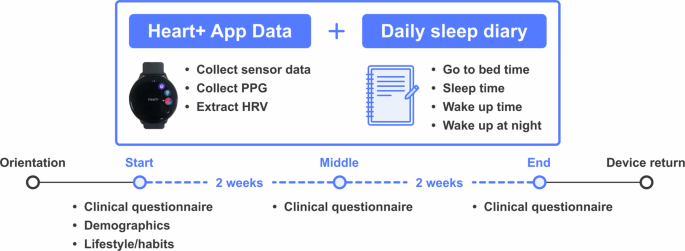
49 healthy men and women aged 21 to 43 (office workers, undergraduates, and graduate students) participated. The overall process was as follows (see Figure 1 below):
- Orientation: Experiment explanation and device distribution.
- Data Collection (4 weeks): Participants wore the watch at all times except while sleeping (charging time).
- Surveys:
- Daily: Sleep diary recording bedtime, wake time, etc.
- Biweekly: Clinical surveys including depression (PHQ-9), anxiety (GAD-7), and insomnia (ISI).

Figure 1: Overview of the 4-week study design. Daily measurements including sensor data, PPG, and HRV were collected through the smartwatch app, and participants recorded bedtime, sleep onset time, wake time, and number of nighttime awakenings in daily sleep diaries. Standardized clinical questionnaires were also administered at the beginning, middle, and end of the study.
The research team monitored participants daily and sent reminders to those who were not wearing the watch consistently or not filling out their diaries. This thorough management was key to obtaining high-quality data.
3. Dataset Contents
The collected data was publicly released on the 'Figshare' repository and is divided into five main categories. A total of 33,600 hours of data was collected, averaging 672 hours per participant.
- Participant Information (
survey.csv): Contains basic information like age, sex, and occupation, along with lifestyle data such as smoking, drinking, and exercise frequency. Mental health survey scores administered biweekly are also included. - Sensor and HRV Data (
sensor_hrv.csv): Data organized in 5-minute intervals.- Sensors: Heart rate, accelerometer, gyroscope, light sensor, step count, etc.
- HRV Metrics: Various indicators of heartbeat variability (SDNN, RMSSD, LF/HF, etc.) are pre-calculated.
- Missing Data Scores: Scores indicating how much signal was lost are included for data quality assessment.
- Sleep Diary (
sleep_diary.csv): Contains participants' self-reported bedtime, sleep onset, wake time, sleep efficiency, and more. - Raw Data: Unprocessed sensor data (PPG, acceleration, etc.) is also provided separately for researchers who want to analyze from scratch.
4. Data Validation
The research team performed several validations to confirm that the data was collected properly.
First, they examined participants' activity patterns. As shown in Figure 5 below, step count and heart rate noticeably increase during lunch hours (11:00-13:00) and evening hours (17:00-19:00). This aligns well with typical daily patterns such as meals, commuting, and movement.
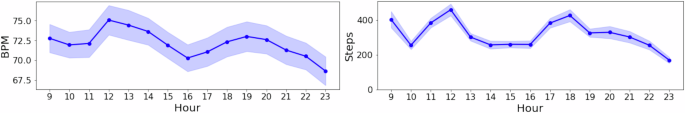
Figure 5: Aggregated hourly trends of heart rate (left) and physical activity (right; steps per hour) for all participants from 9 AM to 11 PM. Shaded areas represent standard error around the mean, showing increased activity around lunchtime and early evening corresponding to meal and commute periods.
HRV data quality was also verified:
- Women and older participants tended to have lower HRV values, consistent with established research findings.
- Sleep diary data also showed reasonable distributions compared to other smart band studies.
Of course, since data was collected in real-world (in-situ) settings rather than laboratories, movement-related noise may be present. However, the team corrected for this as much as possible, filtering out or flagging heavily noisy segments so researchers can account for them.
5. Conclusions and Applications
This dataset has been publicly released as of 2025 for anyone to use freely. The researchers suggest it will be useful in the following areas:
- Mental Health Prediction: Combining wearable data with survey results to develop AI models that predict symptoms such as insomnia, depression, and anxiety.
- Sleep Research: Analyzing how daytime activity and HRV patterns affect sleep that night, and conversely, how sleep quality affects the next day's condition.
- Personalized Healthcare: Comparing health metrics across groups based on lifestyle habits (exercise, regularity, etc.).
Specifically, our continuous wearable data provided alongside sleep diaries will be valuable for predicting the severity of common mental health conditions such as depression and insomnia. (...) We hope this dataset becomes a benchmark for wellbeing research utilizing AI predictive analytics.
As a four-week record of 'healthy individuals' rather than patients with specific conditions, this dataset will serve as an excellent foundational resource for research on everyday health management and disease prevention.