This article is the first part of an explanation of the causal forecasting system Lyft's data science team built to solve marketplace management problems. It covers the business problem, the basic principles, and the modeling techniques behind the system. The system helps Lyft make efficient decisions by accurately predicting downstream outcomes for marketplace management products such as rider coupons, driver bonuses, and pricing. In particular, it focuses not merely on analyzing correlations, but on understanding causal relationships so that Lyft can make forward-looking, smarter decisions.
1. Lyft's Marketplace Management and the Challenge
The core goal of Lyft's data science team is to manage the marketplace efficiently under changing market conditions: provide reasonable incentives to drivers while giving riders affordable fares and short estimated arrival times. To do this, Lyft uses a variety of marketplace management tools, including rider coupons, driver bonuses, and pricing. To use those tools effectively, the team needs a deep understanding of the downstream outcomes that each decision will produce, from app sessions to financial metrics.
The difficulty is that simple correlation is not enough. Past decisions are already tangled together inside the data, so models based only on raw correlation cannot make accurate predictions. Like the classic "chicken or egg" problem, Lyft has to identify what is cause and what is effect before it can make the right decisions. That is why Lyft set out to uncover causality, and why it developed an internal product called Lyft's causal forecasting system. This article covers the system's core ideas and modeling techniques; the next article explains the software used to apply the system in production.
2. Forecasting and Optimization Goals
Lyft is organized around product-centered teams. For example, the rider coupons team focuses on using coupons to increase rider counts and total rides in a cost-efficient way. Each team mainly focuses on metrics directly related to its own product, but the activities of all these teams can be summarized with two important types of variables: key business metrics, or V, and controllable policy variables, or C.
For instance, V1 and V2 might represent rides and revenue, while C1 might represent the rate card, meaning the per-minute or per-mile price that riders pay. Lyft's ultimate goals are twofold:
- Build a model that can accurately predict key business metrics when given a set of policy variables.
- Use that model to choose policy values that optimize the predicted variables.
By achieving these two goals, Lyft can make intelligent decisions across the organization. But doing so requires a substantial technical effort that goes beyond ordinary correlation-based forecasting.
3. Core Principles of Causal Modeling
Lyft's approach relies heavily on causal models. A causal model assumes that every variable is influenced by other variables, and that this structure can be used to predict a given variable. These relationships can be represented as a directed acyclic graph, or DAG.
In a DAG, each variable becomes a node. When one variable is a cause of another variable, a directed edge connects the cause to the outcome. For example, if we assume that average price affects conversion rate, we can express that relationship with the following DAG.
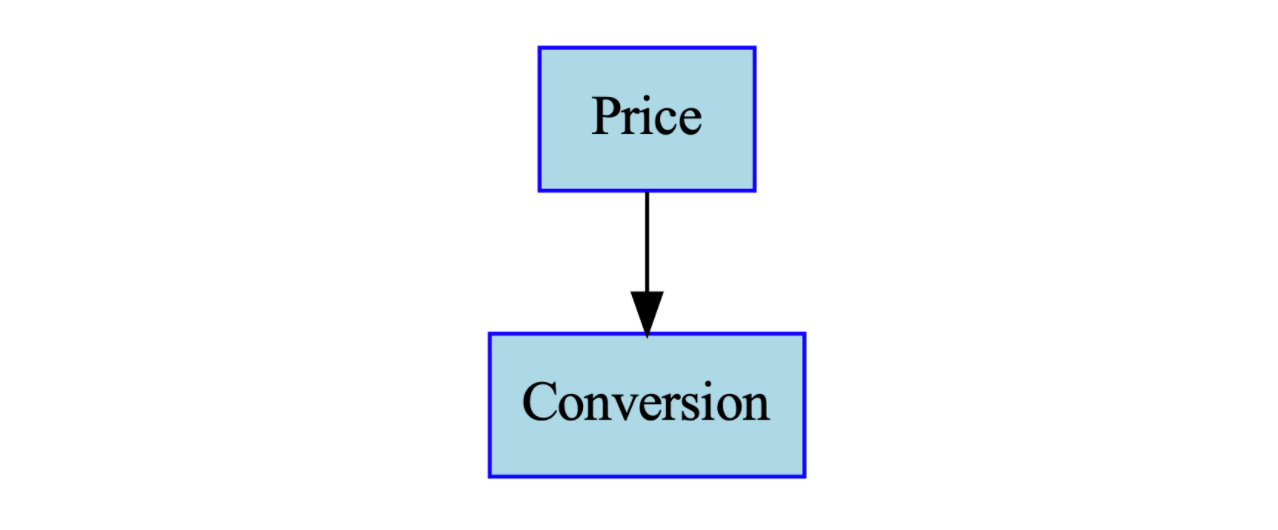
The graph encodes the assumption that conversion rate is caused by price and not by other factors. Going further, if we assume that rides are generated by multiplying sessions and conversion rate, that relationship can also be expressed as a DAG.
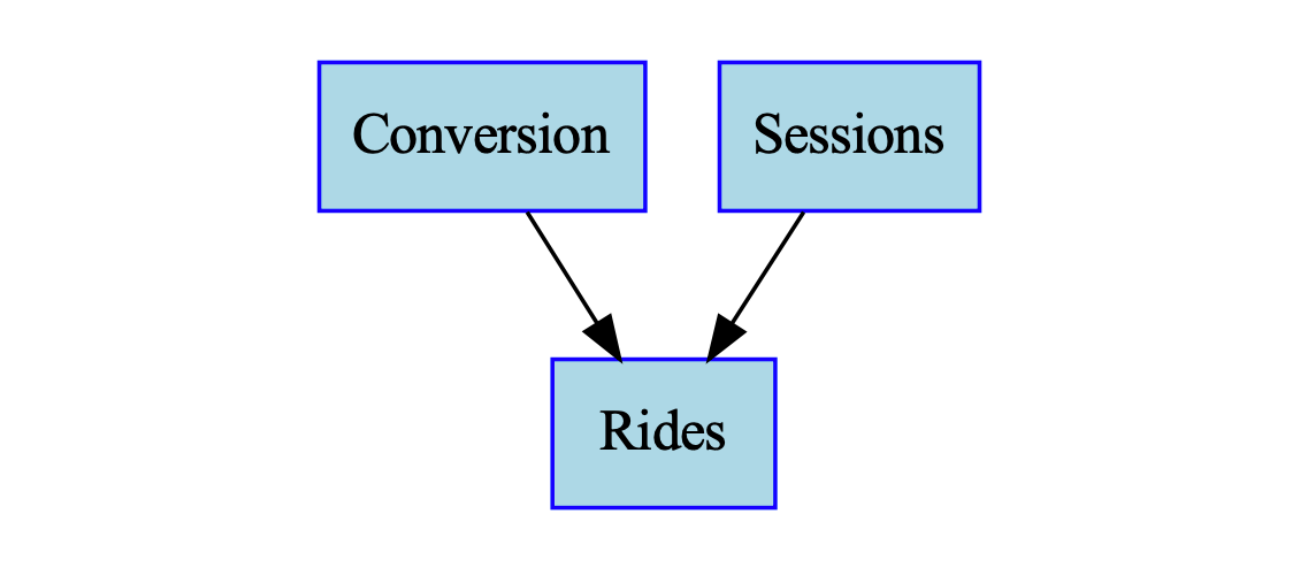
By combining these individual DAGs, the team can create a larger DAG that shows relationships among the overall business variables.

These DAGs enable a divide-and-conquer modeling strategy. In other words, they let the team decompose a complex problem into smaller modeling tasks. Individual data scientists can develop models independently, and those models can then be combined into a larger graph that represents a shared view of the business. Lyft uses experiments to evaluate these links and to identify the functional relationships between policy decisions and outcomes.
4. Driver Incentives Case Study
Consider driver incentives and how they affect driver hours.

If we plot hypothetical data for driver incentive budget and driver hours as a time series and a scatterplot, it looks like this.
At first glance, the scatterplot appears to show a negative correlation. In other words, it looks as if driver hours decrease as budget increases. If we build a model based only on that correlation, we may get a prediction like this.
The problem is the differential relationship that this model predicts between budget and driver hours. If we look at how driver hours would change when the budget is changed on a given day, the model reaches an absurd conclusion: above a certain budget level, it says driver hours would increase if the team reduced the budget.
"If we increase the budget above 60K, driver hours fall? That makes no sense." A model like this cannot be used for real planning.
To solve this problem, Lyft uses an experimentally determined cost curve. Provided by the driver bonuses team, this cost curve shows the actual change in driver hours caused by changes in budget.
When that cost curve is reflected in the model, Lyft can preserve predictive accuracy while developing predictions that are aligned with the driver bonuses team's belief about how the world works, which means the predictions are causally correct.
Now this model is not only accurate; it is also usable for decision-making because it reflects what the driver bonuses team believes will happen when the budget changes. This illustrates the core principle: encode causal assumptions in a DAG, bring in empirical and ideally experimental relationships, and develop a model that fits historical data while still obeying the causal relationship.
5. Model Composition and Business Understanding
The principle above can be applied repeatedly. Causal assumptions are expressed as DAGs, empirical and experimental relationships are integrated into the model, and the model is trained to fit historical data. The data we observe is used to train the model, while experiments provide crucial clues about how our decisions affect outcomes.
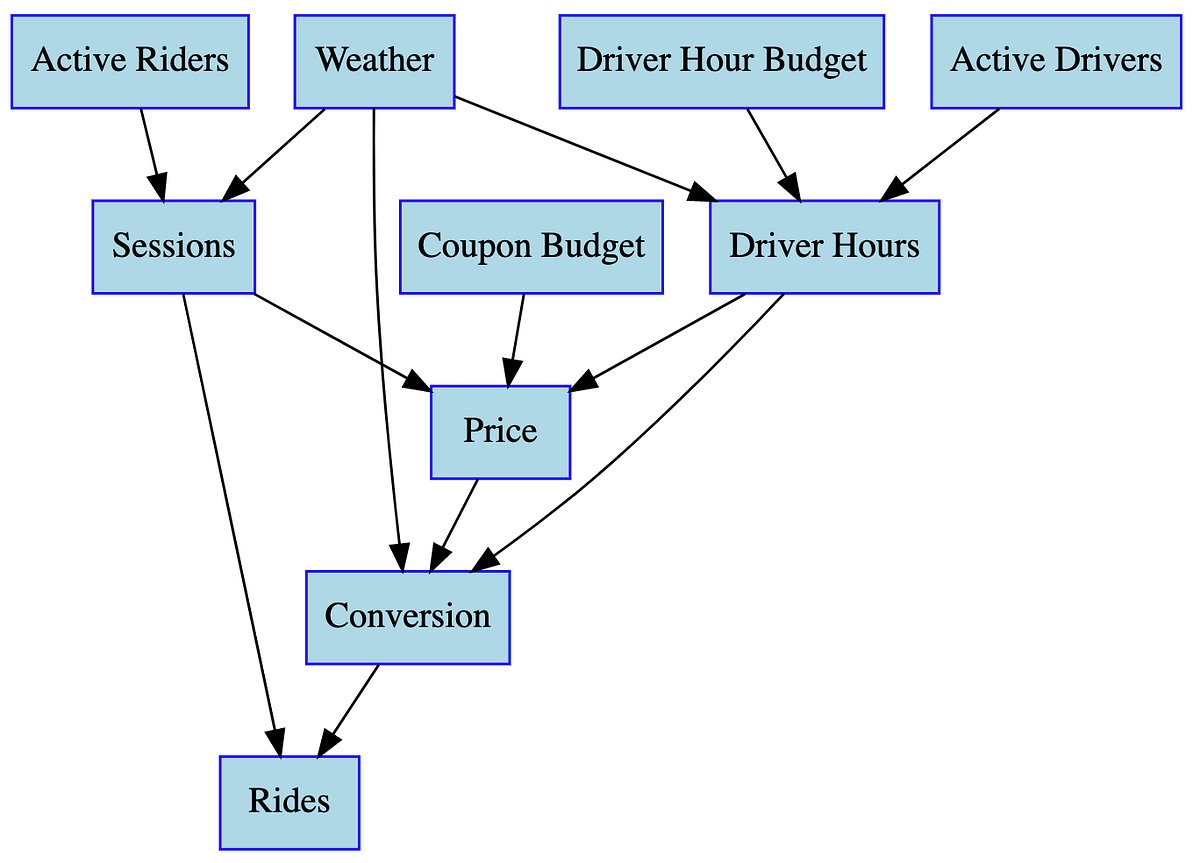
By connecting the various models developed this way, Lyft can build a comprehensive model that shows how the business functions as a whole.
This DAG lets the team see at a glance how the business works. More importantly, if the assumptions are correct, the causal relationships are valid, and the model has predictive power, then this collection of models achieves the first goal described earlier: prediction. In this model, the controllable variables are the inputs, and everything derived from them becomes the output.
6. Planning and Optimization
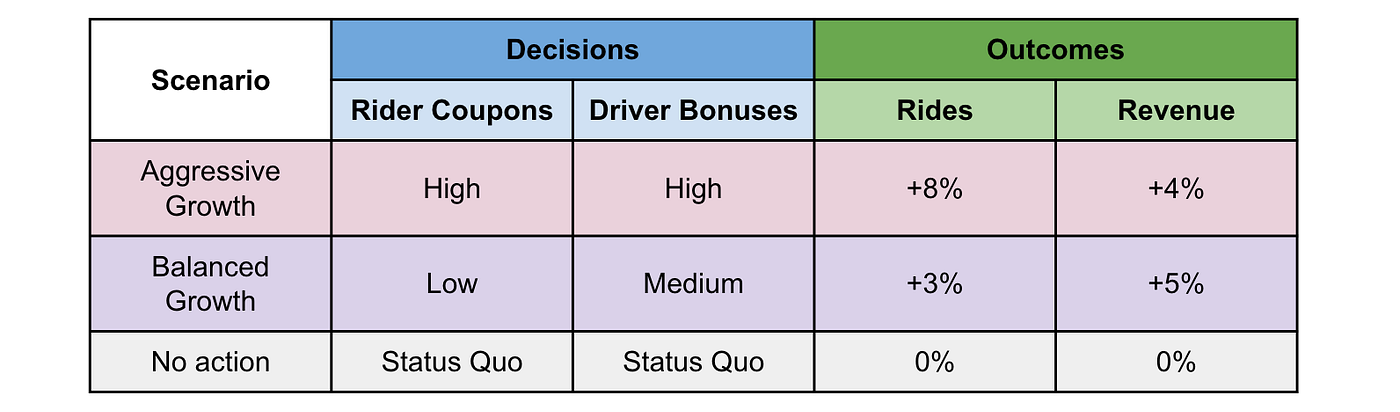
Returning to the original goal of decision-making, this causal model lets Lyft produce conditional predictions based on its decisions. Lyft calls this a plan. Through such plans, decision-makers can evaluate the tradeoffs between a balanced growth strategy and an aggressive growth strategy.
The ability to model multiple scenarios is valuable in itself. In fact, Lyft has a UI that allows people to interact directly with the model.
The models can also be used to optimize specific goals. For example, the team can set an objective such as maximizing total rides while staying within a constraint on rides per revenue. This can be expressed as the following scalar function.

Because the model can predict these variables,

the goal becomes optimizing this function over the policy variables.

With some assumptions and constraints, this can be solved as a multidimensional optimization problem. The next article goes into more detail on that point.
7. Conclusion and Next Steps
For efficient and scalable decision-making, Lyft developed a large-scale causal model with both predictive power and causal validity. The model is a collection of smaller models, and it allows each product team to focus on its own metrics while still reflecting Lyft's shared understanding of the overall marketplace. Ultimately, the system is designed to help decision-makers make informed decisions and then optimize those decisions.
The next article covers solutions to important problems that arose while implementing and scaling this system in practice. Specifically, it answers questions such as:
- How can models be declared quickly and flexibly?
- What software enables independent modeling and seamless integration?
- How can plans, including multidimensional plans, be optimized?
If you are interested in a career in Lyft data science, check out Lyft's careers page.